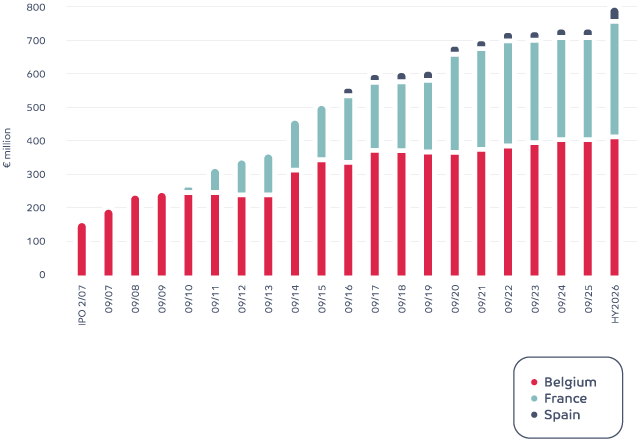
Our portfolio is composed of retail properties on the outskirts of urban areas in Belgium, France and Spain, characterised by a predominance of the food sector.
Portfolio growth
| Consolidated results (€000s) | 31/03/2026 | 31/03/2025 |
|---|---|---|
| Rental income | 27,173 | 27,078 |
| Rental related charges | -118 | 16 |
| Recovery of property charges | 503 | 563 |
| Rental related charges and taxes not recovered | -25 | -60 |
| Other revenue and rental related charges | -163 | -27 |
| Property Result | 27,369 | 27,570 |
| Property charges | -2,520 | -2,709 |
| Corporate overheads | -2,477 | -2,544 |
| Other operating income and charges | -1 | 0 |
| Operating result before result on portfolio | 22,370 | 22,317 |
| Operating margin | 82.3% | 82.4% |
| Financial income | 0 | 472 |
| Net interest charges | -3,137 | -2,991 |
| Other financial charges | -454 | -503 |
| Taxes | -333 | -312 |
| Exclusion of the liquidation result of financial instruments | 0 | -471 |
| EPRA Earnings | 18,447 | 18,512 |
| Result on sales of investment properties | 0 | 43 |
| Change in the fair value of investment properties | -2,510 | -571 |
| Result on the investment property portfolio | -2,510 | -527 |
| Reinstatement of the result from the liquidation of financial instruments | 0 | 471 |
| Change in fair value of financial assets and liabilities | -4,002 | 322 |
| Deffered tax | -399 | -100 |
| NET RESULT | 19,540 | 18,677 |
| EPRA Earnings per share (€) | 2.80 | 2.81 |
| Net result per share (€) | 2.96 | 2.83 |
| Number of shares | 6,595,985 | 6,595,985 |
| Consolidated balance sheet (€000s) | 31/03/2026 | 30/09/2025 |
|---|---|---|
| ASSETS | 807,877 | 773,579 |
| Intangible assets | 456 | 459 |
| Investment properties | 768,640 | 746,468 |
| Other tangible assets | 820 | 778 |
| Other non-current assets | 17,047 | 14,184 |
| Current financial assets | 627 | 666 |
| Trade receivables | 4,209 | 5,257 |
| Cash and cash equivalents | 3,731 | 2,839 |
| Other current assets | 12,348 | 2,928 |
| EQUITY AND LIABILITIES | 807,877 | 773,579 |
| Equity | 440,383 | 450,195 |
| Non-current financial debts | 221,304 | 227,747 |
| Other non-current liabilities | 3,506 | 4,107 |
| Deferred tax liabilities | 7,122 | 6,744 |
| Current financial debts | 115,473 | 69,576 |
| Other current liabilities | 20,089 | 15,210 |
| Liabilities | 367,494 | 323,384 |
| IFRS NAV (€/share) | 66.77 | 68.25 |
| EPRA NTA (€/share) | 65.18 | 67.14 |
| Debt ratio (in accordance with the Royal Decree) | 44.0% | 41.0% |
| EPRA LTV | 44.1% | 40.7% |
| Consolidated result per share (€) | 31/03/2026 | 31/03/2025 |
|---|---|---|
| EPRA Earnings | 2.80 | 2.81 |
| Net result per share | 2.96 | 2.83 |